
XAUUSD-Gold Forex Trade Setup
Chart Analysis:
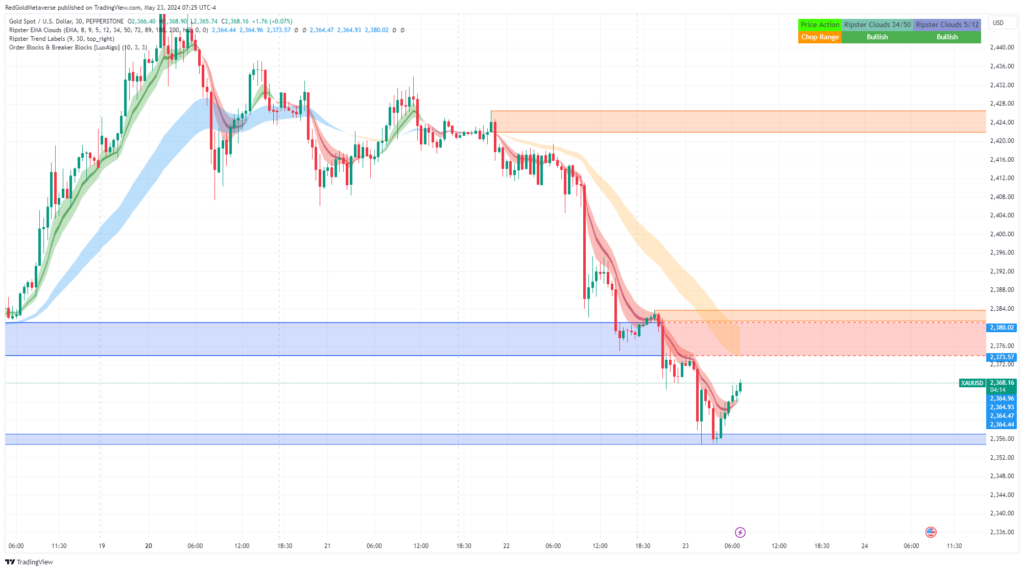
- Price Action:
- The chart shows a recent downtrend in gold prices with a series of lower highs and lower lows.
- The current price is attempting to rebound from a recent low.
- Ripster EMA Clouds:
- The chart uses Ripster EMA Clouds which combine multiple Exponential Moving Averages (EMAs) to visualize trends and potential reversal points.
- The red cloud indicates a bearish trend, while the green and blue clouds indicate a bullish trend.
Join our WhatsApp Group For Daily Trade Setup
Here is the joining Link (Join Now)

- Order Blocks & Breaker Blocks:
- The chart highlights certain zones as potential order blocks where significant buying or selling interest has previously been noted.
- These zones often act as support or resistance.
- Chop Range:
- The chop range indicates areas of consolidation or sideways movement where the market lacks a clear directional bias.
Key Support and Resistance Levels:
- Support Levels:
- First Support Zone: Around 2,356 – 2,360 (highlighted in the blue zone at the bottom).
- This area has acted as a significant support where the price has bounced off recently.
- Second Support Level: Around 2,364 (as indicated by the labels and previous price action).
- First Support Zone: Around 2,356 – 2,360 (highlighted in the blue zone at the bottom).
- Resistance Levels:
- Immediate Resistance Zone: Around 2,373 – 2,380 (highlighted in the red zone at the current price).
- This area is where the price is currently testing and encountering resistance.
- Upper Resistance Zone: Around 2,424 (highlighted in the orange zone).
- This level is where the price previously found resistance and reversed to the downside.
- Immediate Resistance Zone: Around 2,373 – 2,380 (highlighted in the red zone at the current price).
Observations:
- The price is currently trading within a resistance zone (2,373 – 2,380). If the price breaks above this zone and sustains, it could indicate a potential reversal to the upside.
- The support zone around 2,356 – 2,360 is crucial. A break below this level might lead to further downside.
- The Ripster EMA Clouds show a mix of bullish and bearish trends, indicating some level of consolidation or mixed market sentiment.
Trading Considerations:
- Bullish Scenario: If the price breaks above the 2,380 resistance with strong volume, it could target the next resistance around 2,424.
- Bearish Scenario: If the price fails to break the 2,380 resistance and falls below the 2,356 support, it could lead to further declines.
Risk Disclosure Statement
Important Notice:
Trading financial instruments, including stocks, options, futures, forex, and cryptocurrencies, involves significant risk and is not suitable for all investors. The information and trades shared are for educational purposes only. It is imperative that you understand the risks involved before participating in any trading activity.
- Trade at Your Own Risk: All trading activities are conducted at your own risk. The educational content provided does not constitute financial advice or a recommendation to trade. You are solely responsible for your trading decisions and any resulting financial losses.
- Do the Math: Thoroughly analyze and understand the mathematics and strategies behind each trade. Consider factors such as market conditions, historical performance, and risk tolerance. Calculating potential risks and rewards is essential before entering any trade.
- Consult Your Financial Advisor: Before making any trading decisions, it is strongly recommended that you consult with a qualified financial advisor. A financial advisor can provide personalized advice based on your financial situation, goals, and risk appetite.
- Past Performance is Not Indicative of Future Results: Historical data and past performance are not guarantees of future results. Markets can be unpredictable, and strategies that worked in the past may not be successful in the future.
- Potential for Loss: Trading can result in substantial or complete loss of capital. Only trade with money you can afford to lose. It is important to have a comprehensive understanding of the risks involved and to use risk management strategies.
- Market Volatility: Financial markets can be highly volatile and can change rapidly in response to news, economic events, and market sentiment. This volatility can lead to significant fluctuations in the value of your investments.
- Leverage Risks: Utilizing leverage can amplify both gains and losses. While leverage can increase potential returns, it also increases the level of risk. Ensure you fully understand how leverage works and the potential impact on your trading account.
- Educational Purposes Only: The information and examples provided are intended for educational purposes and should not be considered as direct trading advice or an endorsement of any particular investment strategy.
By engaging in trading activities, you acknowledge and accept these risks. It is your responsibility to stay informed and make prudent trading decisions. Always prioritize your financial safety and well-being.