
Analysis of US500 Index Chart – S&P500 Trade Alert
Chart Analysis:
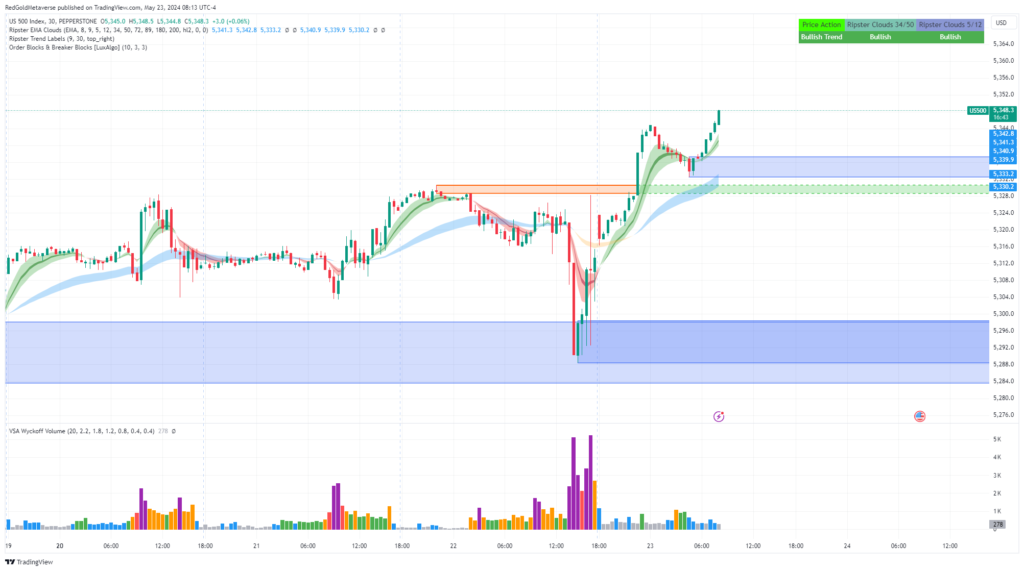
Price Action:
- The US 500 Index (S&P 500) is showing a strong upward movement recently.
- The current price is 5,348.3, and it has broken through previous resistance levels, indicating a bullish trend.
Please Join our WhatsApp Group For Daily Trade Ideas
Here is the joining link. (Join Now)
Ripster EMA Clouds:
- The chart uses Ripster EMA Clouds to indicate trends.
- The presence of green clouds above the price suggests a bullish trend.
Order Blocks & Breaker Blocks:
- There are significant order blocks (highlighted in blue) that act as support zones.
- The orange line around the 5,344 level marks a previous resistance which has now been breached.
Volume Analysis:
- Volume spikes are observed during significant price movements.
- Higher volume on upward movements suggests strong buying interest.
- The recent spike in volume accompanying the price rise indicates a strong bullish sentiment.
Key Support and Resistance Levels:
Support Levels:
- First Support Level: 5,332.0 (highlighted by the green dashed line).
- Second Support Zone: 5,296 – 5,308 (highlighted in the blue zone).
- Third Support Level: 5,288 (lower boundary of the blue support zone).
Resistance Levels:
- Immediate Resistance: None apparent as the price has moved into a new high territory.
- Potential Resistance: Psychological levels such as 5,360 or any levels where price may find resistance based on previous historical data.
Possible Scenarios:
Bullish Scenario:
- The price continues to rise above the current level, maintaining the bullish momentum.
- If the price retraces, it finds support at 5,332 or the previous resistance level of 5,344 (now turned support).
- Targets could be the psychological level of 5,360 or higher, depending on the continuation of the bullish trend and volume support.
Bearish Scenario:
- The price fails to maintain above 5,348 and falls below the 5,344 support level.
- A further decline may find support at 5,332 or within the blue support zone (5,296 – 5,308).
- If the price breaks below the 5,288 support level, it could signal a potential reversal or deeper correction towards lower support levels.
Volume Analysis:
- Bullish Volume: The recent increase in price is supported by higher volume, indicating strong buying interest.
- Bearish Volume: Lower volume during downward movements or consolidations suggests weaker selling pressure.
- Key Volume Observations:
- Volume spikes during the recent uptrend confirm the strength of the bullish movement.
- Monitoring volume during retracements or consolidations will provide clues about the strength of the trend.
Disclaimer:
This analysis is for educational purposes only and should not be considered as financial advice. Trading involves significant risk, and you should conduct your own research or consult a financial advisor before making any trading decisions.